รายชื่อระบบรถไฟใต้ดินในทวีปอเมริกาเหนือเรียงตามจำนวนผู้โดยสาร
หน้าตา
(เปลี่ยนทางจาก รายชื่อระบบรถไฟใต้ดินในอเมริกาเหนือเรียงตามจำนวนผู้โดยสาร)
นี่คือ รายชื่อระบบรถไฟใต้ดินในอเมริกาเหนือเรียงตามจำนวนผู้โดยสาร
| ระบบ | ประเทศ | เมือง/พื้นที่ให้บริการ | จำนวนผู้โดยสารต่อปี (ค.ศ. 2012)[1][2] | จำนวนผู้โดยสารต่อวันโดยเฉลี่ย (ค.ศ. 2013)[3][2] | ระยะทางรวม | จำนวนผู้โดยสารต่อไมล์โดยเฉลี่ยต่อวัน (ค.ศ. 2013) | ปีที่เปิดให้บริการ (ค.ศ.) | จำนวนสถานี | จำนวนเส้นทาง | ภาพ | |
|---|---|---|---|---|---|---|---|---|---|---|---|
| 1 | รถไฟใต้ดินนครนิวยอร์ก | นครนิวยอร์ก | 2,544,892,400 | 8,726,200 | 232 ไมล์ (373 กิโลเมตร)[4] | 37,613 | 1904[note 1] | 468 | 24 | 
| |
| 2 | รถไฟใต้ดินเม็กซิโกซิตี | เม็กซิโกซิตี | 1,604,421,314[note 2] | 4,615,375[note 3] | 140.75 ไมล์ (226.5 กิโลเมตร)[5] | 32,791 | 1969 | 195 | 12 | 
| |
| 3 | รถไฟใต้ดินมอนทรีออล | มอนทรีออล | 176,244,100 | 1,142,800 | 43 ไมล์ (69 กิโลเมตร)[6] | 26,577 | 1966 | 68 | 4 | 
| |
| 4 | รถไฟใต้ดินวอชิงตัน | วอชิงตัน ดี.ซี. | 280,904,200 | 980,800 | 106.3 ไมล์ (171.1 กิโลเมตร)[7] | 9,227 | 1976 | 86 | 5 | 
| |
| 5 | รถไฟใต้ดินและรถไฟความเร็วสูงโทรอนโต | โทรอนโต | 318,760,400[note 4] | 940,300[note 4] | 42.4 ไมล์ (68.2 กิโลเมตร)[8] | 22,177 | 1954 | 69 | 4 | 
| |
| 6 | ชิคาโก แอล | ชิคาโก | 231,154,300 | 729,400 | 102.8 ไมล์ (165.4 กิโลเมตร)[9] | 7,095 | 1892 | 145 | 8 | 
| |
| 7 | การคมนาคมอ่าวแมสซาชูเซตส์[note 5] (สายสีน้ำเงิน สายสีส้ม และสายสีแดง) |
บอสตัน | 165,028,800 | 531,300 | 38 ไมล์ (61 กิโลเมตร)[10] | 13,982 | 1897 | 53 | 3 | 
| |
| 8 | ระบบขนส่งมวลชนอ่าวซานฟรานซิสโก | ย่านอ่าวซานฟรานซิสโก | 123,219,300 | 421,800 | 104 ไมล์ (167 กิโลเมตร)[11] | 4,056 | 1972 | 44 | 5 | 
| |
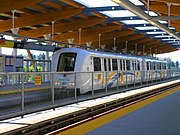
| 9 | สกายเทรน | แวนคูเวอร์ | 120,439,900 | 375,500 | 42.6 ไมล์ (68.6 กิโลเมตร)[12] | 8,815 | 1985 | 47 | 3 | 
| |
| 10 | การคมนาคมรัฐเพนซิลเวเนียตะวันออกเฉียงใต้[13][14][note 5] (สายถนนบรอด สายมาร์เก็ต-แฟรงก์ฟอร์ด และสายนอร์ริสทาวน์) |
ฟิลาเดลเฟีย | 98,171,300 | 336,600 | 36.7 ไมล์ (59.1 กิโลเมตร)[15] | 9,172 | 1907 | 74 | 3 | 
| |
| 11 | รถไฟฟ้าสายทรานส์-ฮัดซัน | นครนิวยอร์ก | 70,548,400 | 250,100 | 13.8 ไมล์ (22.2 กิโลเมตร)[16] | 18,123 | 1908 | 13 | 4 | 
| |
| 12 | องค์การขนส่งมวลชนมหานครแอตแลนตา | แอตแลนตา | 70,506,800 | 220,500 | 48 ไมล์ (77 กิโลเมตร)[17] | 4,594 | 1979 | 38 | 4 | 
| |
| 13 | เมโทรเรล (ลอสแอนเจลิส)[note 5] (สายสีม่วง และสายสีแดง) |
ลอสแอนเจลิส | 48,703,700 | 158,600 | 17.4 ไมล์ (28.0 กิโลเมตร)[18] | 9,115 | 1990 | 16 | 2 | 
| |
| 14 | รถไฟใต้ดินซานโตโดมิงโก | ซานโตโดมิงโก | 30,856,515[19] | 150,600[19][note 3] | 17.0 ไมล์ (27.4 กิโลเมตร)[20][21] | 8,860 | 2008 | 30 | 2 | 
| |
| 15 | เมโทรเรล (ไมแอมี) | ไมแอมี | 19,242,800 | 72,300 | 24.9 ไมล์ (40.1 กิโลเมตร)[22] | 2,904 | 1984 | 23 | 2 | 
| |
| 16 | รถไฟใต้ดินบอลทิมอร์[note 5] | บอลทิมอร์ | 15,399,400 | 60,000 | 15.5 ไมล์ (24.9 กิโลเมตร)[23] | 3,871 | 1983 | 14 | 1 | 
| |
| 17 | เตรนอูร์บาโน | ซานฮวน | 11,023,500 | 40,600 | 10.7 ไมล์ (17.2 กิโลเมตร) | 3,794 | 2004 | 16 | 1 | 
| |
| 18 | แพ็ตโคสปีดไลน์ | ฟิลาเดลเฟีย | 10,612,900 | 37,000 | 14.2 ไมล์ (22.9 กิโลเมตร)[24] | 2,606 | 1936 | 13 | 1 | 
| |
| 19 | การขนส่งมวลชนอาร์ทีเอ[note 5] (สายสีแดง) |
คลีฟแลนด์ | 6,239,900 | 16,730[note 3] | 19 ไมล์ (31 กิโลเมตร)[25] | 881 | 1955 | 18 | 1 | 
| |
| 20 | การรถไฟเกาะสแตเทน | นครนิวยอร์ก | 4,445,100 | 15,000 | 14.0 ไมล์ (22.5 กิโลเมตร)[4] | 1,071 | 1860 | 22 | 1 | 
|
หมายเหตุ
[แก้]- ↑ The current system incorporates elevated sections built in 1870.
- ↑ This Annual Ridership figure for 2012 is obtained by averaging the Average Daily Ridership for the twelve months in 2012, and then multiplying that figure by the number of days in a year.
- ↑ 3.0 3.1 3.2 This is the Average Daily Ridership figure, not an Average Weekday Ridership figure - it is averaged from the Q2 2013 Total Ridership figure for this system.
- ↑ 4.0 4.1 This ridership figure is the sum of the "Heavy Rail (HR)" and "Intermediate Rail (IR)" figures for Toronto from the APTA Ridership report – in other words, this figure includes ridership on the Scarborough RT line which APTA considers to be "Intermediate Rail (IR)".
- ↑ 5.0 5.1 5.2 5.3 5.4 This rapid transit system is integrated with a light rail system; only the parts of the system that are rapid transit/metro, and that are not light rail, are counted in the statistics presented here.
ดูเพิ่ม
[แก้]- รายชื่อระบบรถไฟใต้ดิน
- รายชื่อระบบรถไฟใต้ดินในละตินอเมริกาเรียงตามจำนวนผู้โดยสาร
- รายชื่อระบบรถไฟใต้ดินในสหรัฐอเมริกาเรียงตามจำนวนผู้โดยสาร
- รายชื่อระบบรถไฟใต้ดินเรียงตามจำนวนผู้โดยสารต่อปี
- รายชื่อระบบรถรางและรถไฟฟ้ารางเบา
- รายชื่อระบบรถรางและรถไฟฟ้ารางเบาในอเมริกาเหนือเรียงตามจำนวนผู้โดยสาร
- รายชื่อระบบรถรางและรถไฟฟ้ารางเบาในสหรัฐอเมริกาเรียงตามจำนวนผู้โดยสาร
- รายชื่อระบบรถไฟและรถไฟฟ้าชานเมือง
- รายชื่อระบบรถไฟและรถไฟฟ้าชานเมืองในสหรัฐอเมริกาเรียงตามจำนวนผู้โดยสาร
อ้างอิง
[แก้]- ↑ "APTA Ridership Report - Q4 2012 Report" (PDF) (pdf). American Public Transportation Association (APTA). March 2013. สืบค้นเมื่อ 2013-07-13.
- ↑ 2.0 2.1 "Banco de Información Económica". INEGI. สืบค้นเมื่อ 2013-07-13.
- ↑ "APTA Ridership Report - Q2 2013 Report" (PDF) (pdf). American Public Transportation Association (APTA). August 2013. สืบค้นเมื่อ 2013-09-26.
- ↑ 4.0 4.1 "Comprehensive Annual Financial Report for the Years Ended December 31, 2011 and 2010" (PDF). Metropolitan Transportation Authority. p. 150. คลังข้อมูลเก่าเก็บจากแหล่งเดิม (PDF)เมื่อ 2013-07-22. สืบค้นเมื่อ 2014-02-16.
- ↑ "Datos de operacion" [Operational data] (ภาษาสเปน). Metro de la Ciudad de Mexico. คลังข้อมูลเก่าเก็บจากแหล่งเดิมเมื่อ 2013-10-14. สืบค้นเมื่อ 2013-10-12.
- ↑ "UrbanRail.Net - North America - Canada - Montréal - Montréal Metro". Robert Schwandl (UrbanRail.Net). 2007. สืบค้นเมื่อ 2013-08-23.
- ↑ "Metro Facts 2013" (PDF) (pdf). Washington Metropolitan Area Transit Authority. 2013. คลังข้อมูลเก่าเก็บจากแหล่งเดิม (PDF)เมื่อ 2010-01-13. สืบค้นเมื่อ 2013-07-15.
- ↑ "2012 - TTC Operating Statistics". 2013. คลังข้อมูลเก่าเก็บจากแหล่งเดิมเมื่อ 2021-03-10. สืบค้นเมื่อ 2013-07-26.
- ↑ "Facts at a Glance". Chicago Transit Authority. December 2012. สืบค้นเมื่อ 2013-07-21.
- ↑ "About the T - Financials - Appendix: Statistical Profile" (PDF). MBTA. 2007. คลังข้อมูลเก่าเก็บจากแหล่งเดิม (PDF)เมื่อ 2016-03-03. สืบค้นเมื่อ 2013-07-13.
- ↑ "BART - System Facts". San Francisco Bay Area Rapid Transit District. 213. สืบค้นเมื่อ 2013-08-23.
- ↑ "State of Good Repair". TransLink. March 2013. สืบค้นเมื่อ 2013-07-23.
- ↑ "SEPTA - Media Guide" (PDF) (pdf). Southeastern Pennsylvania Transportation Authority. 2013. คลังข้อมูลเก่าเก็บจากแหล่งเดิม (PDF)เมื่อ 2018-04-17. สืบค้นเมื่อ 2013-07-17.
- ↑ "SEPTA Operating Facts - Fiscal Year 2012" (PDF) (pdf). Southeastern Pennsylvania Transportation Authority. คลังข้อมูลเก่าเก็บจากแหล่งเดิม (PDF)เมื่อ 2013-10-17. สืบค้นเมื่อ 2013-08-03.
- ↑ "SEPTA - Spring 2012 Route Statistics" (PDF) (pdf). Southeastern Pennsylvania Transportation Authority. 2012. คลังข้อมูลเก่าเก็บจากแหล่งเดิม (PDF)เมื่อ 2013-05-24. สืบค้นเมื่อ 2013-07-16.
- ↑ "Facts & Info - PATH - The Port Authority of NY & NJ". 2013. คลังข้อมูลเก่าเก็บจากแหล่งเดิมเมื่อ 2019-11-29. สืบค้นเมื่อ 2013-07-18.
- ↑ "System Updates". Metropolitan Atlanta Rapid Transit Authority (MARTA). August 5, 2011. สืบค้นเมื่อ 2013-07-19.
- ↑ "Facts at a Glance". Los Angeles County Metropolitan Transportation Authority (LACMTA). คลังข้อมูลเก่าเก็บจากแหล่งเดิมเมื่อ 2019-08-20. สืบค้นเมื่อ 2008-03-25.
- ↑ 19.0 19.1 "Estadísticas de peaje y tiempo de recorrido al 2013" [Statistics of tolls and times of route 2013] (PDF). opret.gob.do (pdf) (ภาษาสเปน). Oficina para el Reordenamiento de Transporte (OPRET). p. 2. คลังข้อมูลเก่าเก็บจากแหล่งเดิม (PDF)เมื่อ 2016-03-04. สืบค้นเมื่อ 2013-09-17.
- ↑ "Línea 1" [Line 1] (ภาษาสเปน). Oficina para el Reordenamiento de Transporte (OPRET). คลังข้อมูลเก่าเก็บจากแหล่งเดิมเมื่อ 2013-10-21. สืบค้นเมื่อ 2013-09-17.
- ↑ "Línea 2 - 1ra Etapa" [Line 2 - 1st Stage] (ภาษาสเปน). Oficina para el Reordenamiento de Transporte (OPRET). คลังข้อมูลเก่าเก็บจากแหล่งเดิมเมื่อ 2013-09-30. สืบค้นเมื่อ 2013-09-17.
- ↑ "Miami-Dade County - Miami-Dade Transit - Metrorail". Miami-Dade County. July 9, 2013. สืบค้นเมื่อ 2013-07-18.
- ↑ "Visitors Ride Guide" (PDF) (pdf). Maryland Transit Administration. สืบค้นเมื่อ 2013-07-14.
- ↑ "PATCO - A History of Commitment". PATCO. 2013. สืบค้นเมื่อ 2013-07-16.
- ↑ "2012 Annual Report - Greater Cleveland Regional Transit Authority". Greater Cleveland Regional Transit Authority. December 31, 2012. สืบค้นเมื่อ 2013-07-21.
