
ไฟล์:BernoullisLawDerivationDiagram.png
BernoullisLawDerivationDiagram.png (790 × 370 พิกเซล, ขนาดไฟล์: 9 กิโลไบต์, ชนิดไมม์: image/png)
| รูปภาพหรือไฟล์เสียงนี้ ต้นฉบับอยู่ที่ คอมมอนส์ รายละเอียดด้านล่าง เป็นข้อความที่แสดงผลจาก ไฟล์ต้นฉบับในคอมมอนส์
|

|
ภาพนี้มีภาพในรูปแบบเวกเตอร์ (SVG)
หากภาพ SVG ทำให้การแสดงผลดีกว่า หน้าที่ใช้ภาพนี้ควรเปลี่ยนไปใช้ภาพ SVG แทน File:BernoullisLawDerivationDiagram.png → File:BernoullisLawDerivationDiagram.svg
สำหรับข้อมูลเพิ่มเติมเกี่ยวกับภาพเวกเตอร์ ดูที่ การเปลี่ยนไปใช้ภาพ SVG ในคอมมอนส์ นอกจากนี้สามารถดูเพิ่มเติมเกี่ยวกับ ข้อมูลเกี่ยวกับการรองรับภาพ SVG สำหรับซอฟต์แวร์มีเดียวิกิ ได้ |
 |
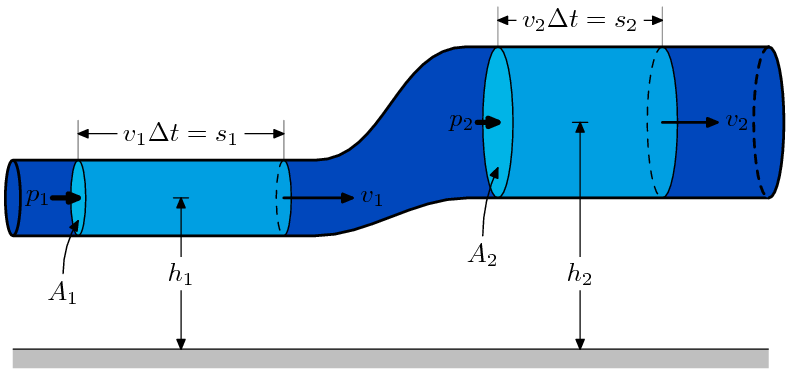
This is a diagram for one derivation of Bernoulli's Equation. I created this image using MetaPost; in order to produce the raster form, I compiled the source with MetaPost, embedded the resulting file in a pdfLaTeX document, viewed the PDF file with GSview (I tried Acrobat Reader, but its antialiasing was rather poor), and took a screen capture.
The MetaPost source code for this image is provided below (it is licensed under the same licenses as the image) in order to allow easy modification of the image. It's not particularly well-written code (one of my goals in creating it was to learn MetaPost), but anyone who might find it useful can try to make some use of it.
%%%%%%%%%%%%%%%%%%%%%%%%%%%%%%%%%%%%%%%%%%%%%%%%%%%%%%%%%%%%%%%%%%%%%%%%%%%%%%
%  bernoulli.mp                                                              %
%  A MetaPost diagram                                                        %
%  Created on 12 July 2005                                                   %
%  Copyright (c) 2005 by MannyMax                                            %
%  Some rights reserved; see accompanying information for details            %
%%%%%%%%%%%%%%%%%%%%%%%%%%%%%%%%%%%%%%%%%%%%%%%%%%%%%%%%%%%%%%%%%%%%%%%%%%%%%%

beginfig(1);

u := 1cm;
path t,b,m,pa[],pb[];
pair a[],b[];
picture alab[],blab[];
numeric lwidth,lheight,rwidth,rheight,tubelen,cpgap;
color backcol,chunkcol,capcol;

lwidth = 1u;
rwidth = 2u;
lheight= 2u;
rheight= 3u;
tubelen= 10u;
cpgap  = 1u;

%set diagram colors
backcol = 0.27734375*green + 0.73828125*blue;
chunkcol= 0.62500000*green + 0.88281250*blue;
capcol  = 0.70703125*green + 0.90234375*blue;

z0=(                0, lheight+(lwidth/2));
z4=((tubelen/2)-cpgap, lheight+(lwidth/2));
z5=((tubelen/2)+cpgap, rheight+(rwidth/2));
z1=(          tubelen, rheight+(rwidth/2));

z2=(                0, lheight-(lwidth/2));
z6=((tubelen/2)-cpgap, lheight-(lwidth/2));
z7=((tubelen/2)+cpgap, rheight-(rwidth/2));
z3=(          tubelen, rheight-(rwidth/2));

t=z0---z4..z5---z1;
b=z2---z6..z7---z3;
m=1/2[z0,z2]..1/2[z4,z6]..1/2[z5,z7]..1/2[z1,z3];

fill buildcycle(z0--z2,t,z1--z3,b) withcolor backcol;

fill unitsquare xscaled tubelen yscaled 0.25u shifted (0,-0.25u) withcolor 0.75*white;
linecap := butt;
draw (0,0)--(tubelen,0);
linecap := rounded;

%DRAW CHUNK A

a0=point(0.3) of t;
a1=point(0.8) of t;
a2=point(0.3) of b;
a3=point(0.8) of b;
pa1=buildcycle(a0--a2,t,a1--a3,b);

pa2 = fullcircle rotated 180 xscaled (0.2*lwidth) yscaled lwidth shifted 1/2[a0,a2];
pa3 = halfcircle rotated -90 xscaled (0.2*lwidth) yscaled lwidth shifted 1/2[a1,a3];
pa4 = halfcircle rotated  90 xscaled (0.2*lwidth) yscaled lwidth shifted 1/2[a1,a3];

pa5 = buildcycle(pa2,t,pa3,b);

fill pa2 withcolor capcol;
fill pa5 withcolor chunkcol;
draw pa2;
draw pa3;
draw pa4 dashed evenly;

a9 = center(buildcycle(pa4,pa3));
pa6 = a9--(a9+(a9-center(pa2))/3);
draw      pa6 cutafter  pa3 withpen pencircle scaled 1;
drawarrow pa6 cutbefore pa3 withpen pencircle scaled 1;
label.rt (btex $v_1$ etex, point(1) of pa6);

pa7 = (a2-(0.2u,0.5u)){dir(90)}..2/5[a2,center(pa2)];
drawarrow pa7;
label.bot(btex $A_1$ etex, point(0) of pa7);

a4 = whatever[a0,a3]=whatever[a1,a2];
a5 = (xpart(a4),0);
a6 = a5+(0,1u);
drawdblarrow a5--a4;
draw (a4-(0.1u,0))--(a4+(0.1u,0));
alab1 = thelabel(btex $h_1$ etex, (0,0));
unfill bbox alab1 shifted a6;
draw        alab1 shifted a6;

a11 = center(pa2);
a10 = a11+(a11-a9)/8;
drawarrow a10--a11 withpen pencircle scaled 2;
label.lft(btex $p_1$ etex, 1/4[a10,a11]);

a7 = a0 + (0,0.35u);
a8 = a1 + (0,0.35u);
draw a0--(a7 + (0,0.175u)) withcolor 0.5*white;
draw a1--(a8 + (0,0.175u)) withcolor 0.5*white;
drawdblarrow a7--a8;
alab2 =thelabel(btex $v_1\Delta t=s_1$ etex, (0,0));
unfill bbox alab2 shifted 1/2[a7,a8];
draw alab2 shifted 1/2[a7,a8];

%DRAW CHUNK B

b0=point(2.2) of t;
b1=point(2.6) of t;
b2=point(2.2) of b;
b3=point(2.6) of b;
pb1=buildcycle(b0--b2,t,b1--b3,b);
fill pb1 withcolor 0.6[blue,white];

pb2 = fullcircle rotated 180 xscaled (0.2*rwidth) yscaled rwidth shifted 1/2[b0,b2];
pb3 = halfcircle rotated -90 xscaled (0.2*rwidth) yscaled rwidth shifted 1/2[b1,b3];
pb4 = halfcircle rotated  90 xscaled (0.2*rwidth) yscaled rwidth shifted 1/2[b1,b3];

pb5 = buildcycle(pb2,t,pb3,b);

fill pb2 withcolor capcol;
fill pb5 withcolor chunkcol;
draw pb2;
draw pb3;
draw pb4 dashed evenly;

b9 = center(buildcycle(pb4,pb3));
pb6 = b9--(b9+(b9-center(pb2))/3);
draw      pb6 cutafter  pb3 withpen pencircle scaled 1;
drawarrow pb6 cutbefore pb3 withpen pencircle scaled 1;
label.rt (btex $v_2$ etex, point(1) of pb6);

pb7 = (b2-(0.2u,0.5u)){dir(90)}..2/5[b2,center(pb2)];
drawarrow pb7;
label.bot(btex $A_2$ etex, point(0) of pb7);

b4 = whatever[b0,b3]=whatever[b1,b2];
b5 = (xpart(b4),0);
b6 = b5+(0,1u);
drawdblarrow b5--b4;
draw (b4-(0.1u,0))--(b4+(0.1u,0));
blab1 = thelabel(btex $h_2$ etex, (0,0));
unfill bbox blab1 shifted b6;
draw        blab1 shifted b6;

b11 = center(pb2);
b10 = b11+(b11-b9)/8;
drawarrow b10--b11 withpen pencircle scaled 2;
label.lft(btex $p_2$ etex, 1/4[b10,b11]);

b7 = b0 + (0,0.35u);
b8 = b1 + (0,0.35u);
draw b0--(b7 + (0,0.175u)) withcolor 0.6*white;
draw b1--(b8 + (0,0.175u)) withcolor 0.6*white;
drawdblarrow b7--b8;
blab2 =thelabel(btex $v_2\Delta t=s_2$ etex, (0,0));
unfill bbox blab2 shifted 1/2[b7,b8];
draw blab2 shifted 1/2[b7,b8];

%DRAW FLUID TUBE

linecap := butt;

draw t withpen pencircle scaled 1;
draw b withpen pencircle scaled 1;

path acap,bcap,bcapa,bcapb;
acap  = fullcircle rotated 180 xscaled (0.2*lwidth) yscaled lwidth shifted 1/2[z0,z2];
bcapa = halfcircle rotated -90 xscaled (0.2*rwidth) yscaled rwidth shifted 1/2[z1,z3];
bcapb = halfcircle rotated  90 xscaled (0.2*rwidth) yscaled rwidth shifted 1/2[z1,z3];

bcap = buildcycle(bcapa,bcapb);

fill acap withcolor backcol;
fill bcap withcolor backcol;

linecap := rounded;

draw acap  withpen pencircle scaled 1;
draw bcapa withpen pencircle scaled 1;
draw bcapb withpen pencircle scaled 1 dashed evenly;

%uncomment the following line to draw a density symbol in the center of the figure
%label (btex $\rho$ etex, 1/2[point 1.5 of t, point 1.5 of b]);

endfig;

|
อนุญาตให้คัดลอก แจกจ่ายและ/หรือดัดแปรเอกสารนี้ภายใต้เงื่อนไขของสัญญาอนุญาตเอกสารเสรีของกนู รุ่น 1.2 หรือรุ่นใด ๆ นับจากนี้ที่ออกโดยมูลนิธิซอฟต์แวร์เสรี โดยไม่มีส่วนใดห้ามแก้ไข ไม่มีข้อความปกหน้าและปกหลัง สำเนาของสัญญาอนุญาตรวมอยู่ในส่วนชื่อ สัญญาอนุญาตเอกสารเสรีของกนู |
| ไฟล์นี้อยู่ภายใต้สัญญาอนุญาต ครีเอทีฟคอมมอนส์ แบบแสดงที่มา-อนุญาตแบบเดียวกัน 3.0 ต้นฉบับ | ||
| ||
| ป้ายแสดงสถานะลิขสิทธิ์นี้ถูกเพิ่มเพื่อให้เป็นไปตามการเปลี่ยนแปลงสัญญาอนุญาตของมูลนิธิวิกิมีเดีย จาก GFDL ไปยัง GFDL ควบคู่กับ CC-BY-SA 3.0 |
- คุณสามารถ:
- ที่จะแบ่งปัน – ที่จะทำสำเนา แจกจ่าย และส่งงานดังกล่าวต่อไป
- ที่จะเรียบเรียงใหม่ – ที่จะดัดแปลงงานดังกล่าว
- ภายใต้เงื่อนไขต่อไปนี้:
- แสดงที่มา – คุณต้องให้เกียรติเจ้าของงานอย่างเหมาะสม โดยเพิ่มลิงก์ไปยังสัญญาอนุญาต และระบุหากมีการเปลี่ยนแปลง คุณอาจทำเช่นนี้ได้ในรูปแบบใดก็ได้ตามควร แต่ต้องไม่ใช่ในลักษณะที่แนะว่าผู้ให้อนุญาตสนับสนุนคุณหรือการใช้งานของคุณ
- อนุญาตแบบเดียวกัน – หากคุณดัดแปลง เปลี่ยนรูป หรือต่อเติมงานนี้ คุณต้องใช้สัญญาอนุญาตแบบเดียวกันหรือแบบที่เหมือนกับสัญญาอนุญาตที่ใช้กับงานนี้เท่านั้น
ประวัติไฟล์
คลิกวันที่/เวลาเพื่อดูไฟล์ที่ปรากฏในขณะนั้น
| วันที่/เวลา | รูปย่อ | ขนาด | ผู้ใช้ | ความเห็น | |
|---|---|---|---|---|---|
| ปัจจุบัน | 10:37, 13 กรกฎาคม 2548 | | 790 × 370 (9 กิโลไบต์) | MannyMax~commonswiki | {{GFDL}} {{cc-by-sa-2.5}} |
หน้าที่มีภาพนี้
หน้าต่อไปนี้ โยงมาที่ภาพนี้:
การใช้ไฟล์ข้ามโครงการ
วิกิอื่นต่อไปนี้ใช้ไฟล์นี้:
- การใช้บน anp.wikipedia.org
- การใช้บน ar.wikipedia.org
- การใช้บน az.wikipedia.org
- การใช้บน bs.wikipedia.org
- Isaac Newton
- Blaise Pascal
- Robert Hooke
- Augustin Louis Cauchy
- Potisak
- Leonhard Euler
- Robert Boyle
- Mehanika fluida
- Hookeov zakon
- Joseph Louis Gay-Lussac
- Šablon:Mehanika kontinuuma
- Mehanika čvrstih tijela
- Viskoznost
- Statika fluida
- Mehanički napon
- Bernoullijeva jednačina
- Dinamika fluida
- Fluid
- Daniel Bernoulli
- Zakon održanja mase
- Deformacija (mehanika)
- Navier–Stokesove jednačine
- Claude-Louis Navier
- George Gabriel Stokes
- Hagen–Poiseuilleova jednačina
- Njutnovski fluid
- Savijanje
- Elastičnost (fizika)
- Čvrsto stanje
- Mehanika kontinuuma
- การใช้บน ca.wikipedia.org
- การใช้บน cs.wikipedia.org
- การใช้บน da.wikipedia.org
- การใช้บน de.wikipedia.org
- การใช้บน en.wikipedia.org
- การใช้บน en.wikiversity.org
ดูการใช้ข้ามโครงการเพิ่มเติมของไฟล์นี้